
We already got to know the Kubernetes operator in this article . The Kubernetes API is expanded with its own resource definitions and can be used as a punch as often as you like. The Prometheus Operator is such a punch that Rancher has embedded in his tool when the app is installed via the Marketplace and yet the Reveals independence. The proxy functionality in the browser can be experienced in practice when the internal services Prometheus and Grafana are addressed via Rancher authentication.
The first thing the application needs to do is export metrics for monitoring. There are useful already finished exporters such as Flask , but you can also use Prepare Shell-Scripts data for export.
Next up is ServiceMonitor. This is the first extension of the Kubernetes API when the Prometheus operator is installed in the cluster. So it can be easily checked with kubectl api-versions . As seen in this example , the ServiceMonitor is a simple matter. It describes the end point of our app where metric data can be expected.
The Prometheus instance can also as further in the example can be described as a simple execution. The Apply creates a POD in the named namespace with the Prometheus running in it. A service is required to make this accessible, or even an Ingress if it can be accessed from the Internet. At Rancher, we use the built-in proxy functionality, so we don’t need the Ingress.
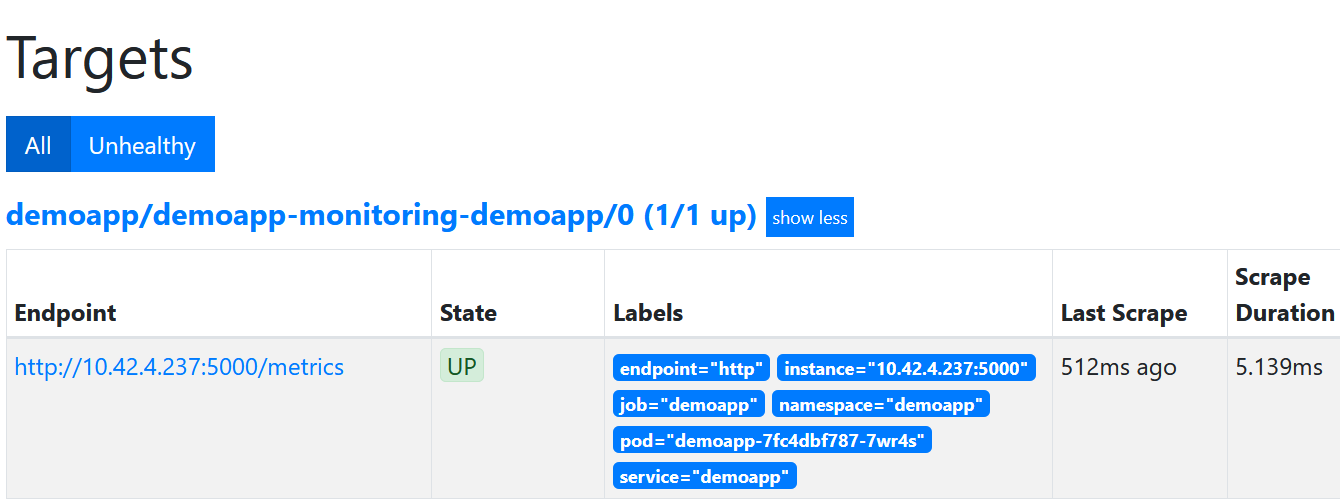
If the connection is successful, you should find the instance of the app in the Prometheus UI under “Service Discovery” or “Targets”. Otherwise you should check whether the Prometheus is really running and whether all labels are set correctly.
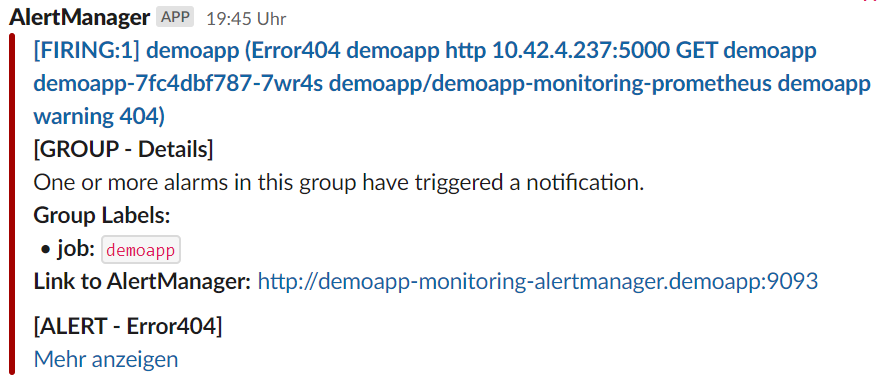
What comes with the Prometheus operator is the alert manager. This has two main functions. One is the receiver, it can be a Slack channel or it can be sent by e-mail. The other is the router. There it is decided which alarms are sent to which receiver. The main router/receiver is the alert manager itself. All alarms can be seen on their website.
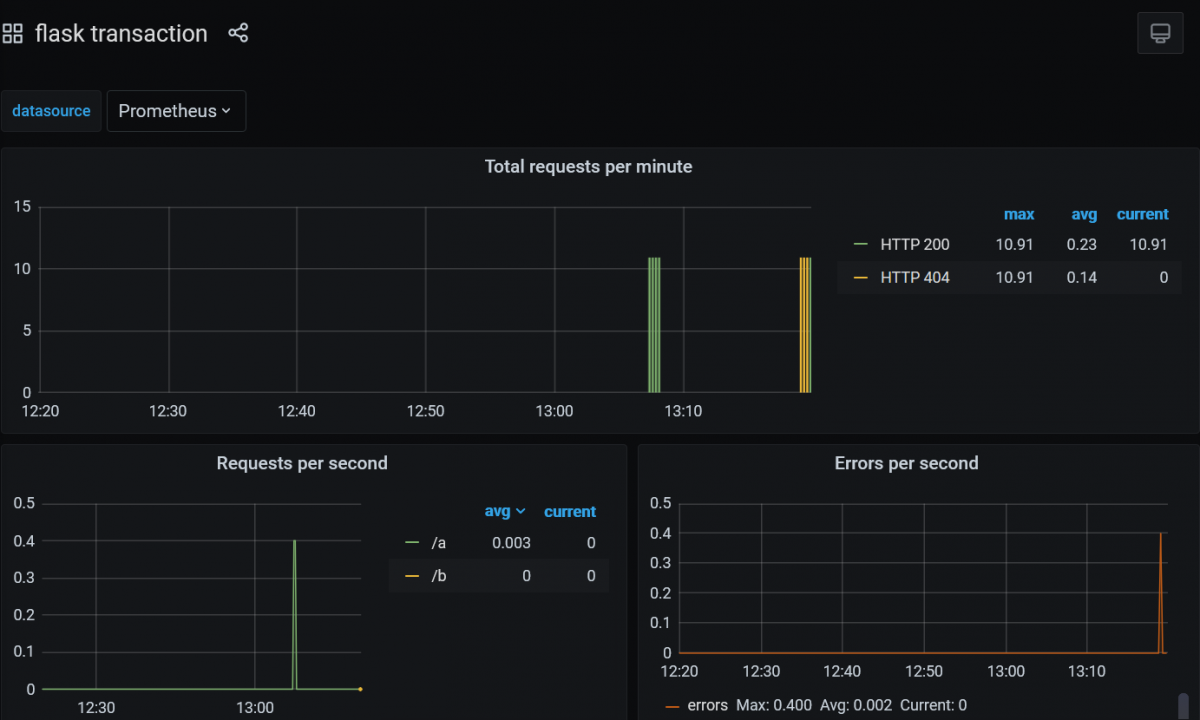
And what’s not included in the Prometheus operator is Grafana. If there is a need, an instance must be deployed independently, again with the proxy functionality used by Rancher.
How does it look like or how can you look at it?
The normal URL for monitoring, which is also available via the Cluster Explorer menu, is for Grafana:
https://<rancher-server>/api/v1/namespaces/cattle-monitoring-system/services/http:rancher-monitoring-grafana:80/proxy/
Here we just change the names of the namespace and Prometheus instance in the URL in the browser:
https://<rancher-server>/api/v1/namespaces/gnuu/services/http:gnuu-monitoring-grafana:80/proxy/
Other services such as Prometheus or Alertmanager can also be reached in this way.
Happy Monitoring
Note: The configuration of the receivers and routes in the alert manager is currently still solved using a secret. There will soon be own resources via CRD, which can then be written to directly. On the other hand, these configurations can also contain secret data, which is why you might want to keep the secret.</rancher></rancher>