
Sustainable computing, also known as Green IT, is the careful use of computer resources with respect to the environment. On the one hand, there are the devices themselves and the circumstances under which they are manufactured. But daily use and the level of electricity consumption also play a role, as more or less CO2 is produced during its production.
In the age of the cloud, the computer is located somewhere in a data center. With a virtual machine you only use a part of it and with a pod in a Kubernetes cluster you only use a tiny part of it. But there may be a lot of them.
Electricity is produced very differently these days. There is no longer just a power plant that drives turbines by burning coal, which then ultimately feed a generator that then supplies the electricity. We now have wind turbines, solar parks, hydroelectric power plants, all of which provide electricity. Of course, production should be as cheap as possible, so cheaper varieties are preferred. The need varies at different times of the day.
Let’s look at the current electricity mix in Germany:
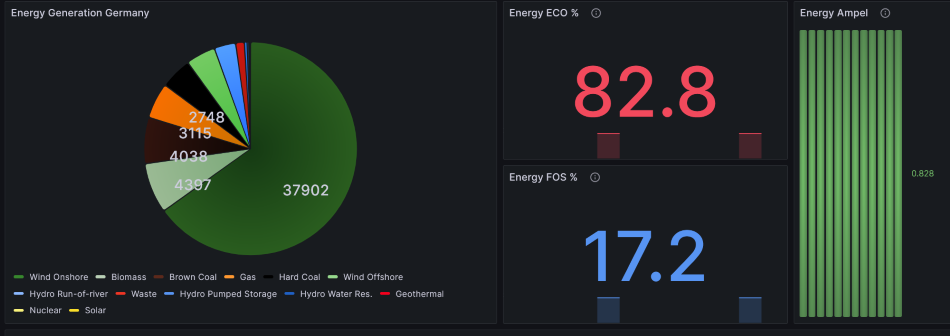
Data are collected by Entso, the transparency platform for publishing data for generating energy in pan-europe area.
Emissions are the sum of all substances that an energy generation system emits during operation. This usually refers to pollutants such as sulfur, tar and smoke. Climate research has focused on the greenhouse gas CO2. For each type of energy generation, constants can now be derived as to how many grams of CO2 are lost per kWh of electricity. For lignite there are currently 966, for offshore wind farms there are 4. But the numbers are not that constant. The technology of the lignite power plant, for example, is constantly evolving and so its emissions cannot be compared today with the plants of 1950 or 1990. The efficiency has been increased considerably and there are hardly any exhaust gases. Nevertheless, the brown coal power plant has to serve as a stereotype for delayed climate protection.
All in all, you can derive a CO2g/s value from the graphic above and use it to create an energy traffic light showing when the electricity is actually particularly green. The data applies throughout Germany. In other countries you can break this down into regions and cities, because electricity always follows the path of least resistance and so there will be regional nuances as to which region the electricity is greener. However, such data is not available for Germany in real time.
In order to measure the power consumption of electrical devices, small measuring devices are usually required that are mounted between the socket and the device. You can then use this to measure the current flowing through and thus the consumption. In computers there is the ACPI, the Advanced Configuration and Power Interface. The measuring device is basically already in the computer and can be queried using a number of tools. The issue became more complicated with virtual machines. For a long time, measuring the power consumption of virtual machines was quite scientific. Fortunately, that has now changed! And it goes one step further with Kepler (Kubernetes-based Efficient Power Level Exporter). A Prometheus exporter that uses eBPF to get measurement data from the CPUs and Linux kernel tracepoints. Not only cgroup-v2 but also v1 is supported, so it also works with older systems such as Ubuntu 20.04.
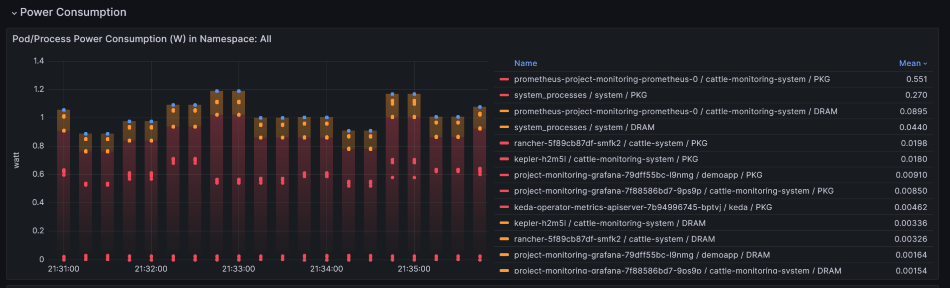
Kepler breaks these metrics down to the POD level in the Kubernetes cluster. You can display the data visually using the included Grafana dashboard.
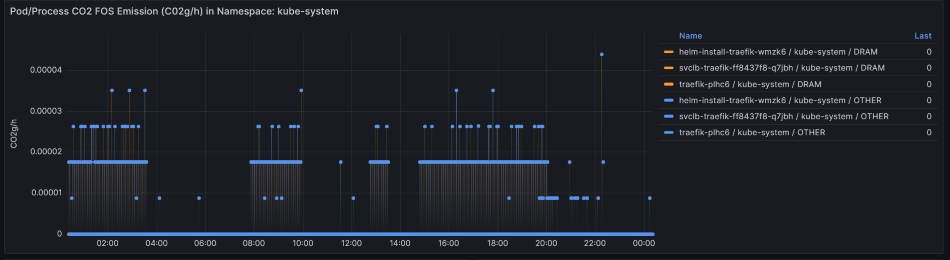
Let’s stick with the graphical representation. In the Grafana dashboard ‘CaaS Carbon Footprint’ we bring together the data from Kepler and Entsoe. Kepler already supplies its data for Prometheus using ServiceMonitor, and we need the same for Entsoe. This delivers this repo, the Helm Chart there bundles the 2 applications and installs them into a Kubernetes cluster.
What can you see there then? Further up there was a panel with the current energy mix and a traffic light that shows whether it makes ecological sense to start your workload.
Once it’s running, you can read the CO2 grams per hour on this panel. In our test cluster this is obviously not that much:
This makes you aware of the topic of carbon footprint and allows you to focus on your workload. Of course, it may have to run at any time of the day or night. Or you can have it autoscale with Keda as shown in the last post. In the Repo there are also a few examples of what else can be done to protect the climate.