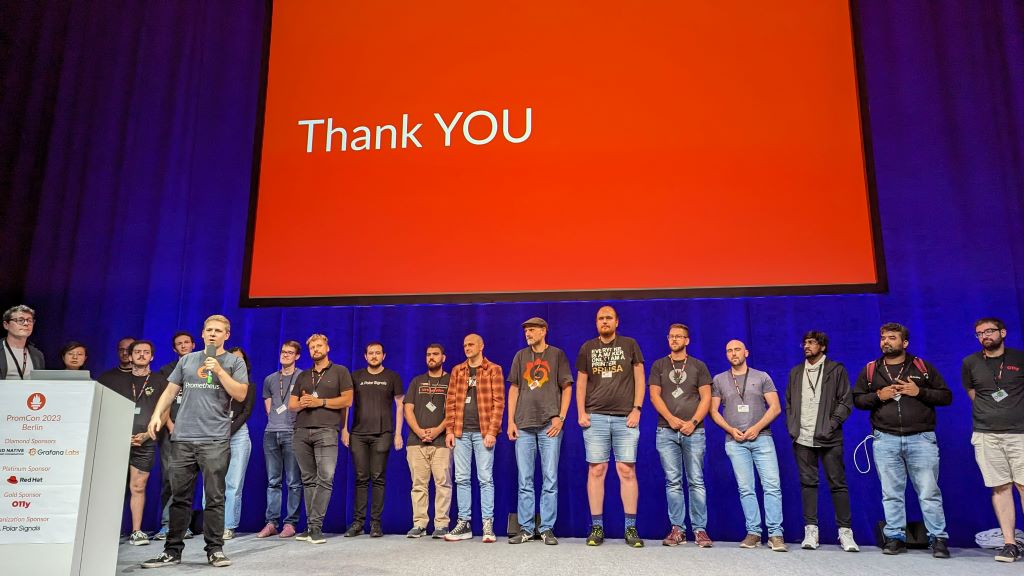
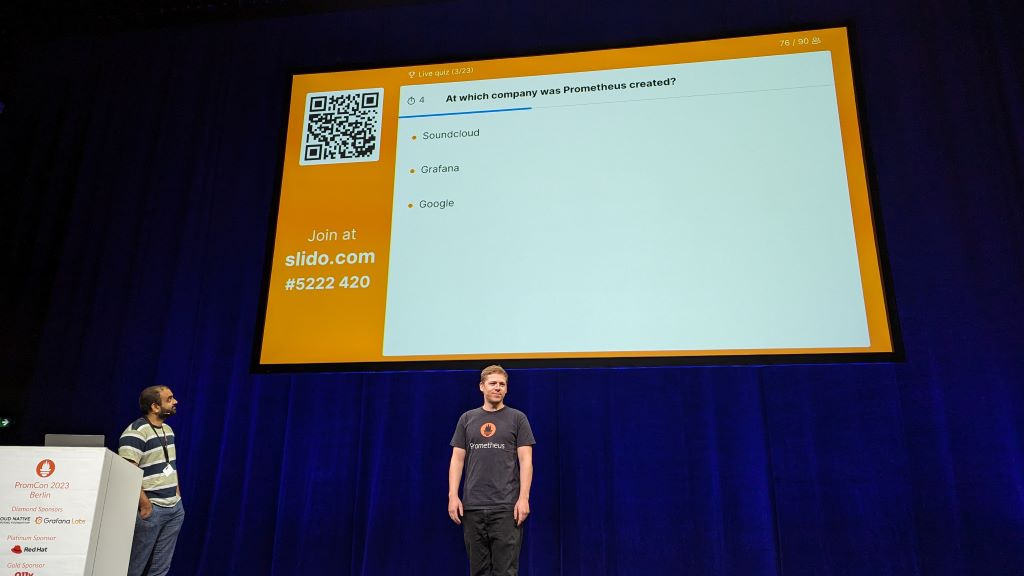
Did you know? Prometheus, the de facto standard monitoring system for Kubernetes, was invented 2012 in Berlin by a company named Soundcloud? Soundcloud was (or is still) a music streaming service, which required a scalable monitoring system wide before Kubernetes was born. Luckily enough the software goes Open Source 2015 and was CNCF graduated one year later. Soundcloud was not so successful, so many people have to left the company and landed at Polarsignals, also located in Berlin, or moved on to Grafana Labs, a world-wide operating company with nearly 1000 employees. And many of them joined us today.
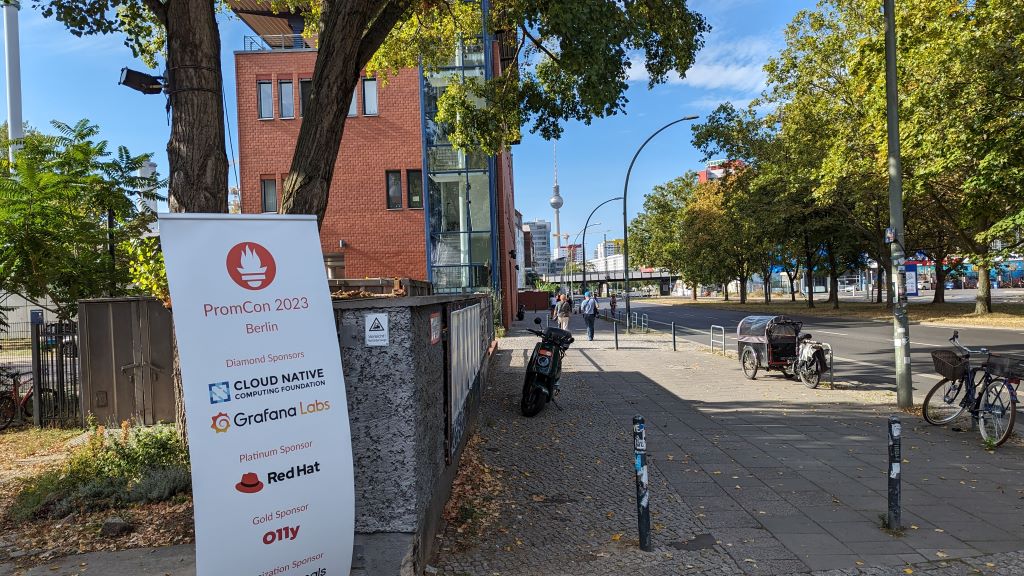
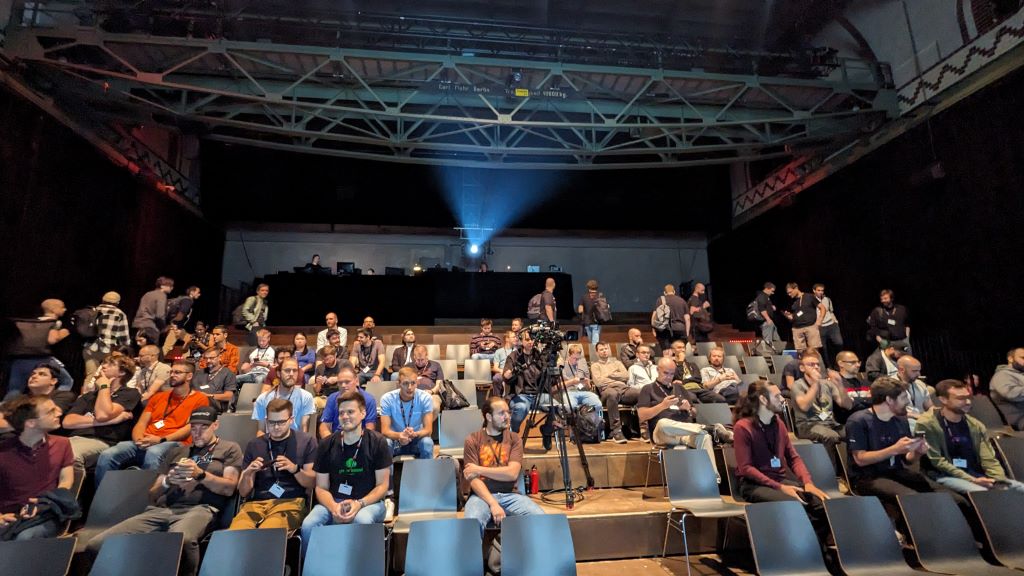
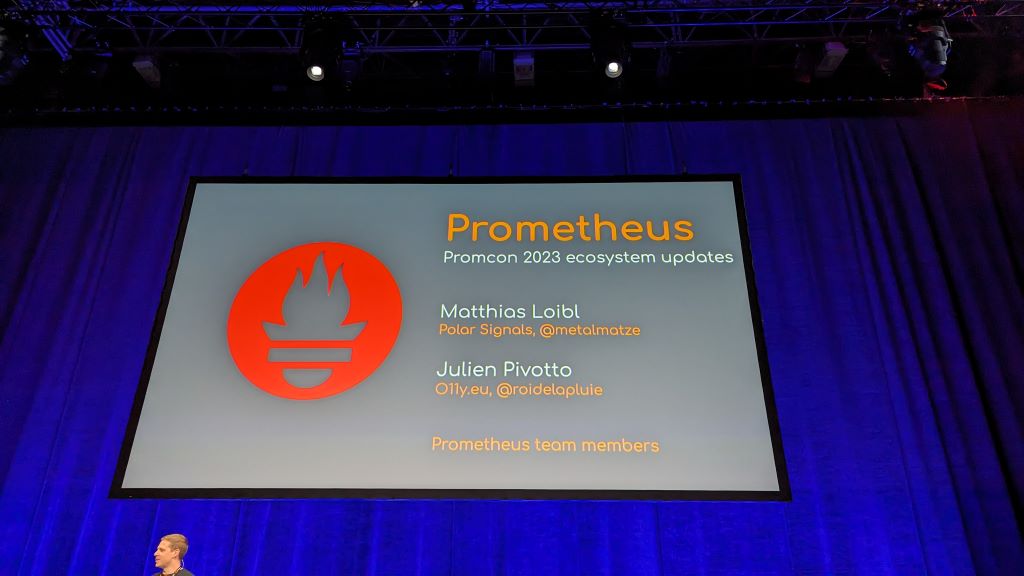
These and other facts was presented as kickoff by Matthias Loibl (@metalmatze). We are at Radialsystem, a formerly pump station in the middle of Berlin (Germany) directly on the river Spree. The weather couldn’t be better for this 2-days-CNCF event: PromCon EU 2023. Sunny, nearly 25 degrees, and it’s the end of September.
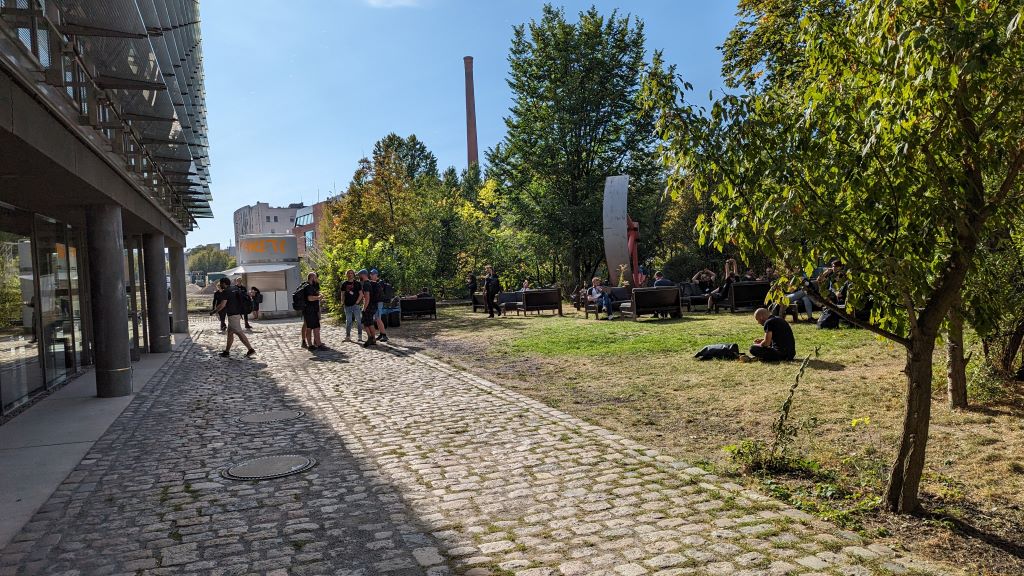
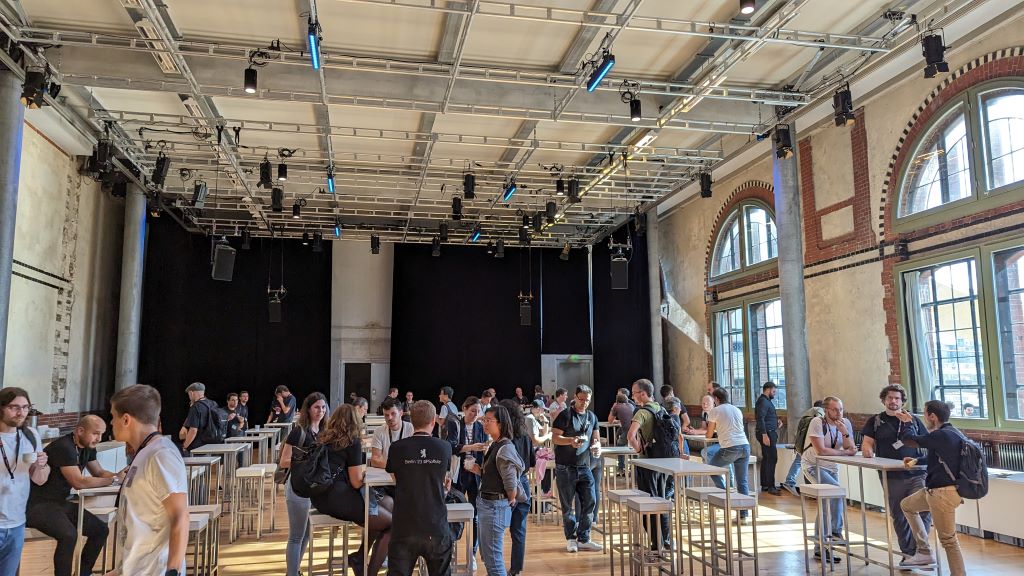
The venue was divided in a theatre for the conference track, a second hall for taking food and conversation, and additionaly and outside area to take seat on a comfortable chair with view to the Spree.

Speaking of theatre: Did you know Prometheus The Documentary? A short movie about the history of Prometheus. And the second movie tip: There was a live stream of the whole conference, which is still available on Youtube. So, great prepared and well working infrastructure. Not to forget the excellent catering by Hoflieferanten Berlin. Many of the conference participants have now an idea about Königsberger Klopse.
Head-lighted features since last KubeCon:
Community work was presented at https://prometheus.io/community. Not to forget the Dev Summit, which was held a day after the PromCon on Saturday in Berlin. There is a live agenda on Google Docs full packed with links and information. Beside the in-person event, where also guests are welcomed, a live stream on Google Meet was also available.
This comes to topic: what’s next on Prometheus? Maybe a new Alertmanager UI will be helpful. Remote Write v2 will have more performance improvements.
Not really breakout because we are still in the theatre. There is nothing to move in other rooms and buildings. An advantage of the conference with around 100 participants.
One of the biggest thing in the future will be the change to Open Telemetry Standard. Goutham Veeramachaneni and Jesus Vasquez from Grafana Labs turned attention on it and made a comparison.
Another Grafana Labs session by Nikola Grcevski and Mario Macias presented Beyla, a tool for zero-code application metrics with eBPF and Prometheus. Automatic instrumentation of a service with eBPF, very interesting to see.
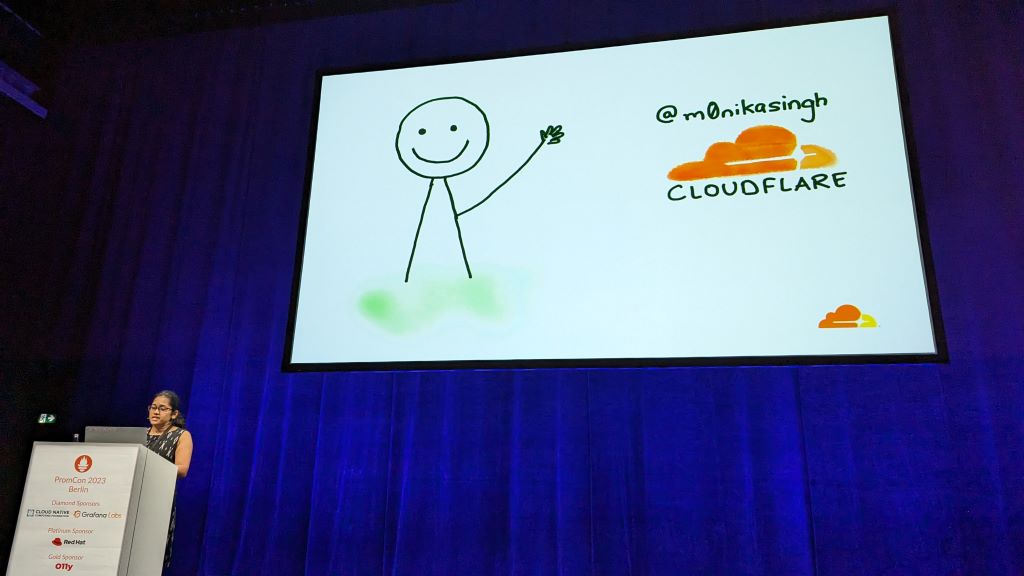
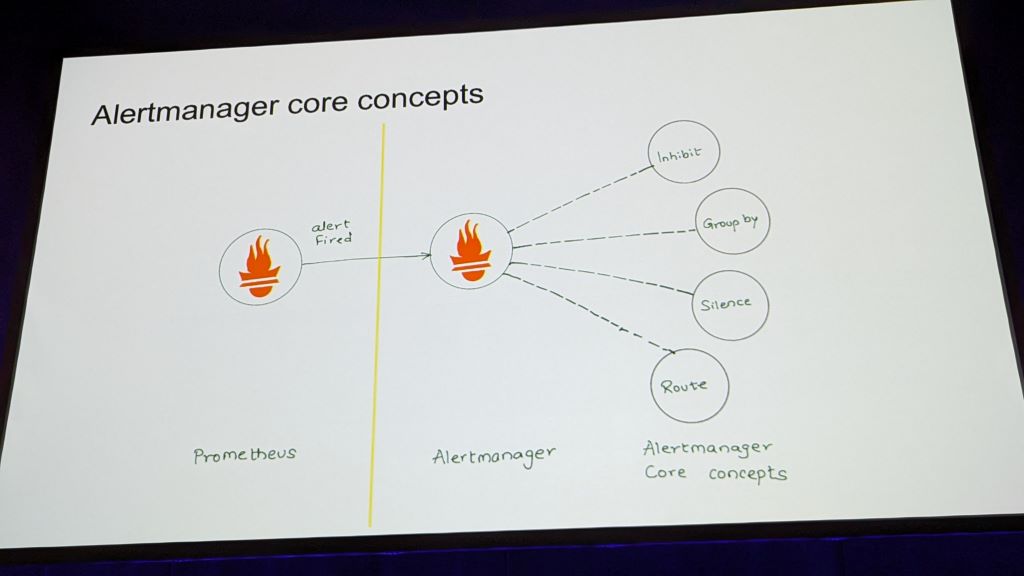
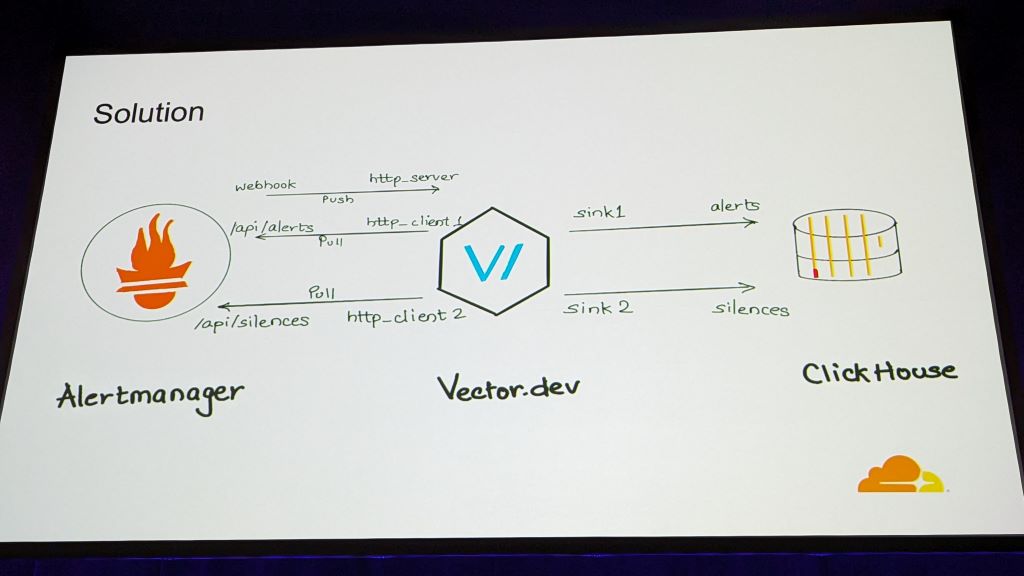
A session from the field from Monika Singh by Cloudfare, how to handle Alertmanager data in bigger environments. Working example in this Github repo.
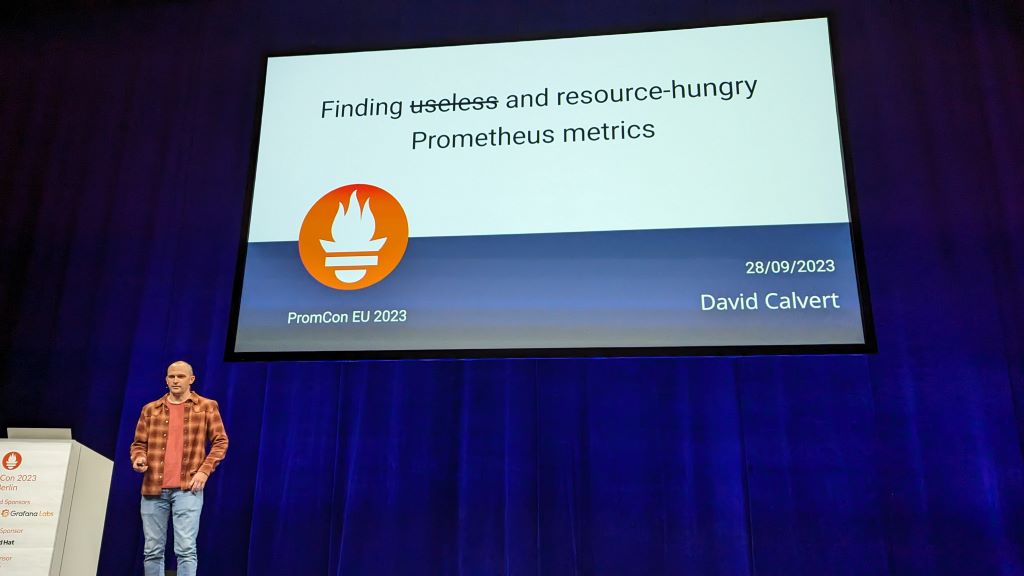
By David Calvert, best session so far. Every Prometheus user is overwhelmed with tons of metrics, which blows up the Prometheus Pod and eats up all memory of the Kubernetes Node, where the Pod is running. Now it’s time to make a deep inspection, which metrics are really used and which are only stored in the Prometheus database. Here is a blog post about three elementary things.
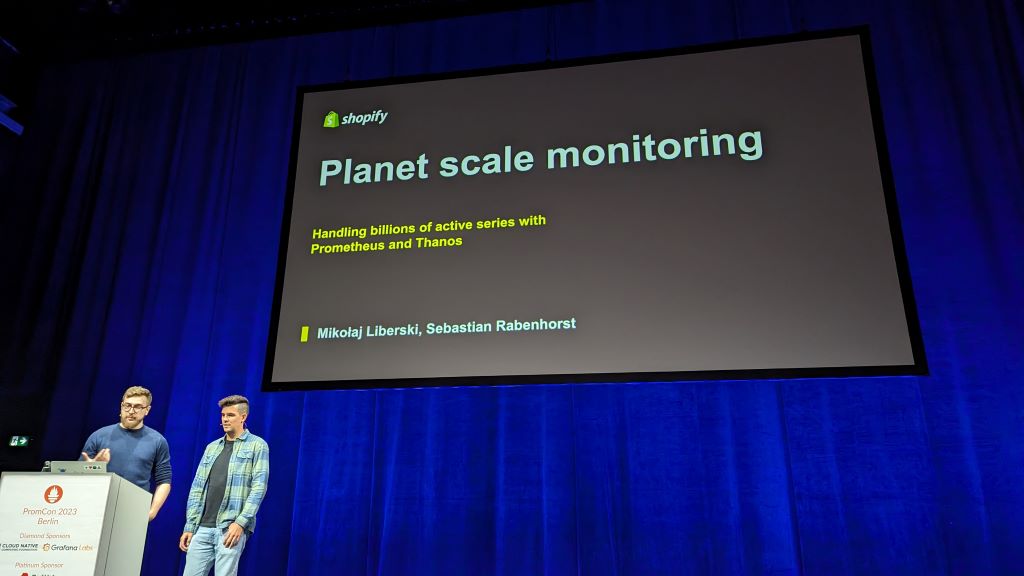
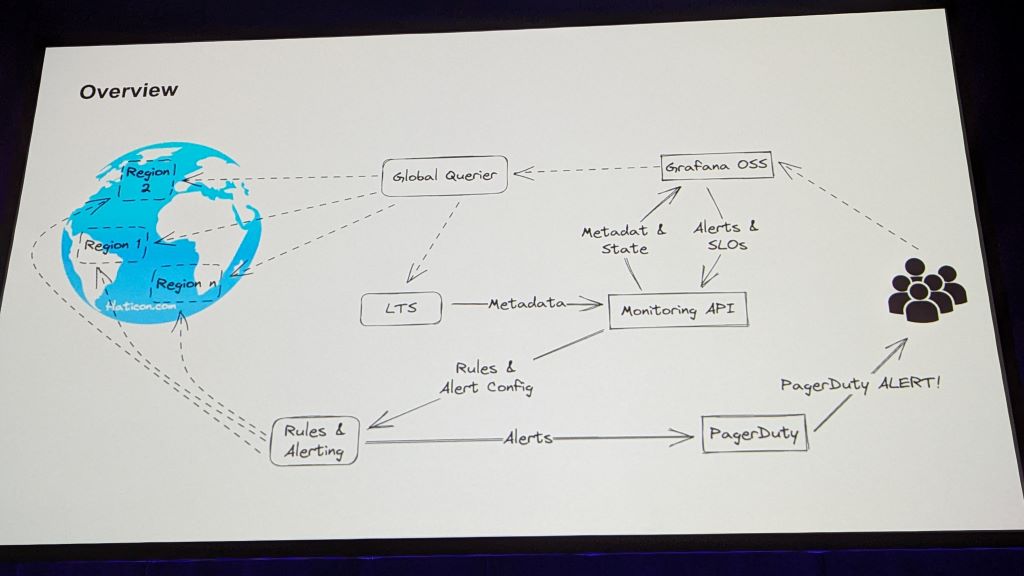
I was impressed, Shopify has nearly thousand public repos on Github, a brave Open Source company. What we’ve got to see from Sebastian Rabenhorst and Mikołaj Liberski were some high-level global architecture picture from the Shopify Operations, but it didn’t quite fit the frame of the audience. PromCon is a conference for really tech. No marketing talks, no ads. I didn’t catch the story of this session, while the real technical background remained hidden for confidentiality reasons or whatever.
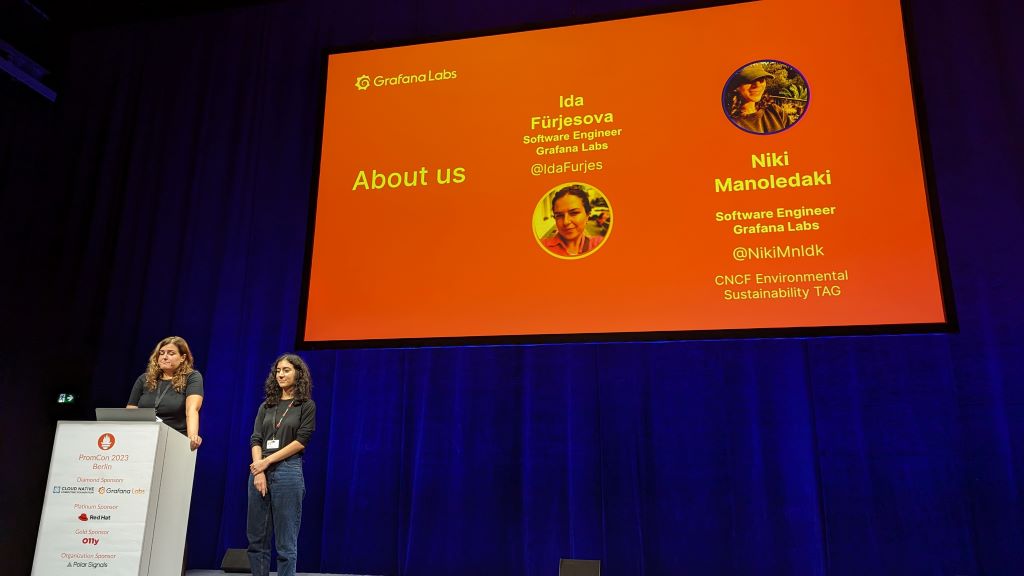
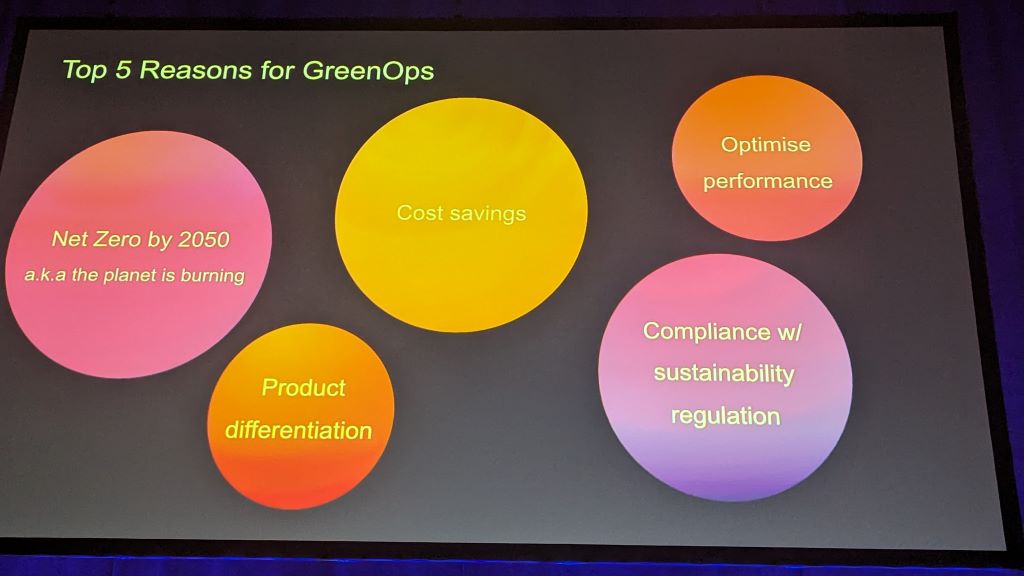
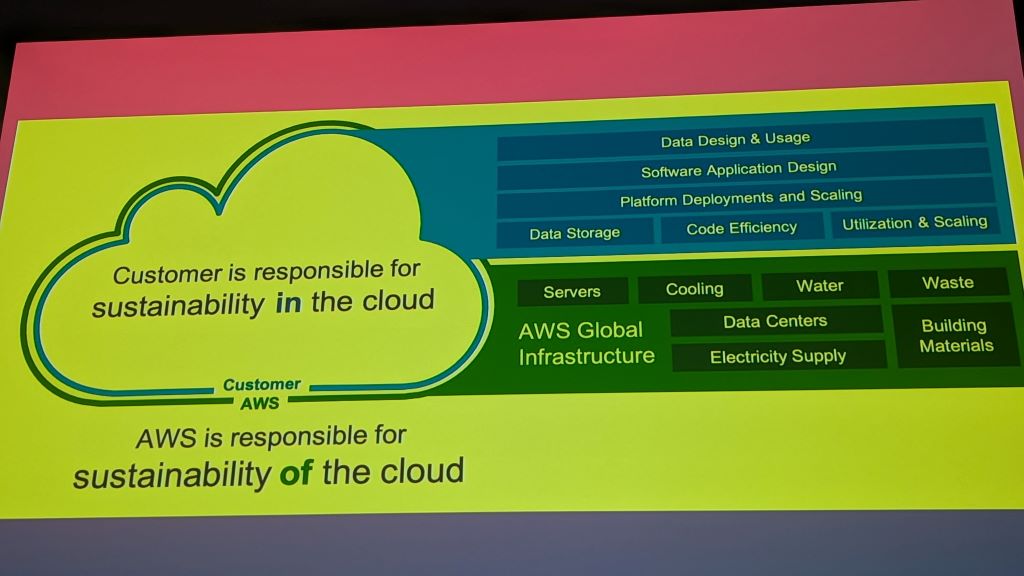
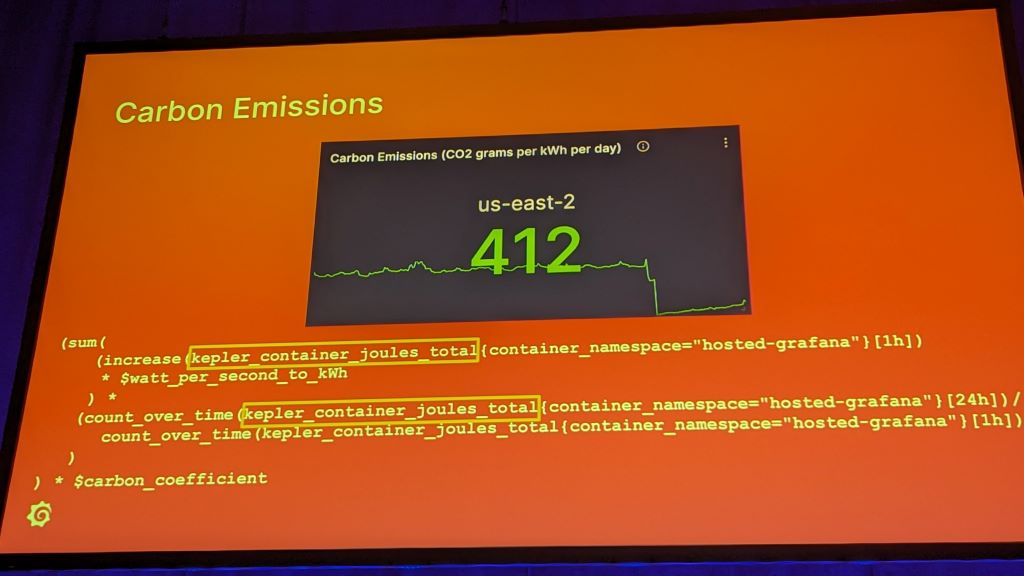
Just another session by Grafana Labs by Ida Fürjesová and Niki Manoledaki. Are we aware that data center have the most carbon emission of the world? More than aviation? Climate adhesive would block our conference immediately when this becomes known. So, it’s really time for GreenOps. But it’s a different field for measure carbon footprints on container level. Cloud Providers like AWS provides some high-level data about your workload into the bill. With Kepler you can measure this at your own. But needs raw access to the Kubernetes nodes and works only in a region which is known by https://www.watttime.org/ with an efficient data flow in real time.

Each conference day ended with a bunch of lightning talks. Sessions with a length of 5 minutes, very spontaneous to different topics. Very interesting and funny. Also funny was the Surprise Trivia Quiz in the beginning of the next day.
By Frederic Branczyk, the founder of Polarsignals. A very interesting session about Debugging and Profiling an application. On Youtube there are various live hacking sessions. There is also this Profile Exporter on Github available.
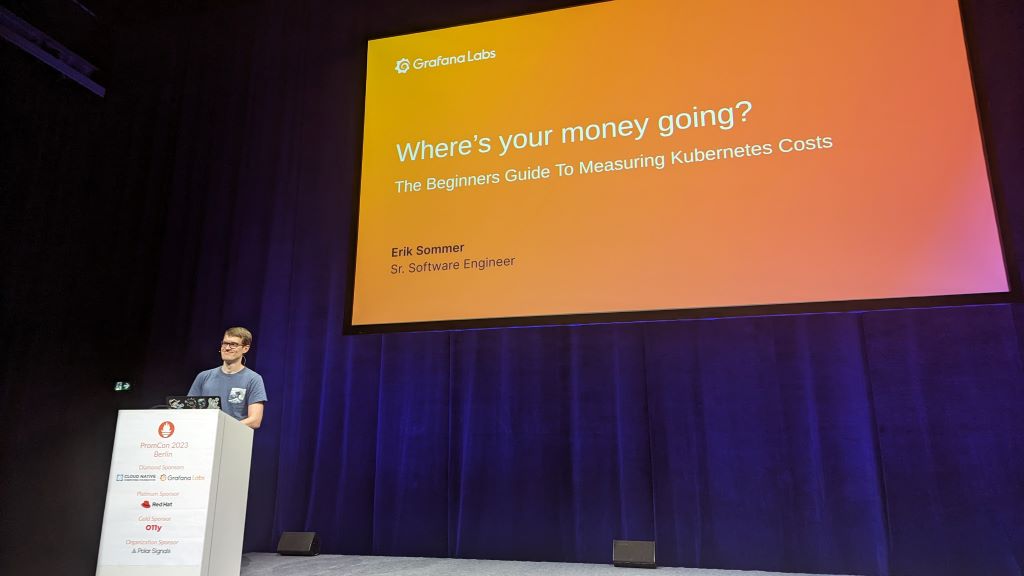
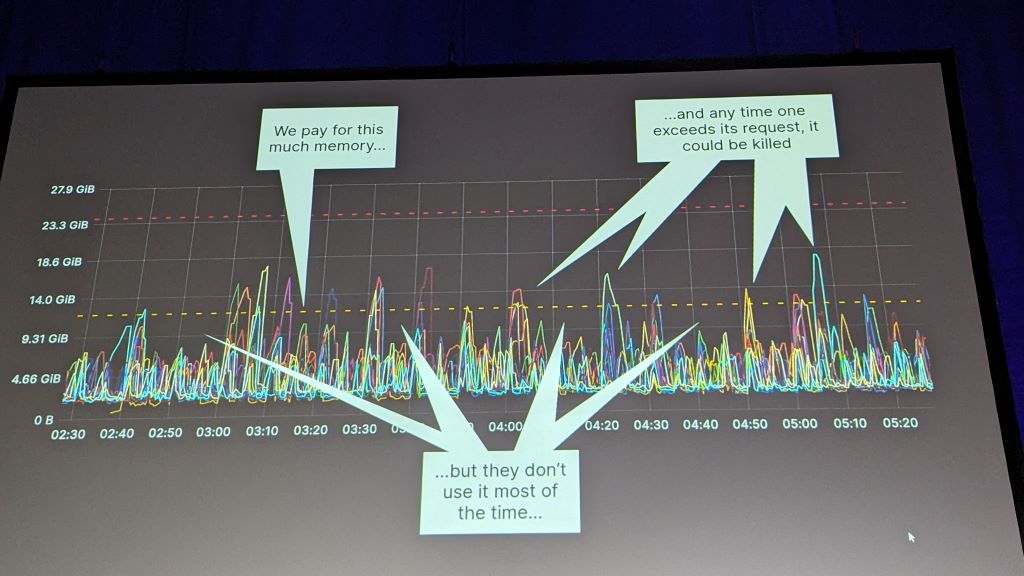
Erik Sommer, a young and ambitious SRE from Grafana Labs, explained the possibilities of KubeCost and Grafana to find out where’s your money burned in load peaks while memory consumptions of applications.
After the lunch of the second day it comes to a point where we got to much metrics and Prometheus topics. Right away:
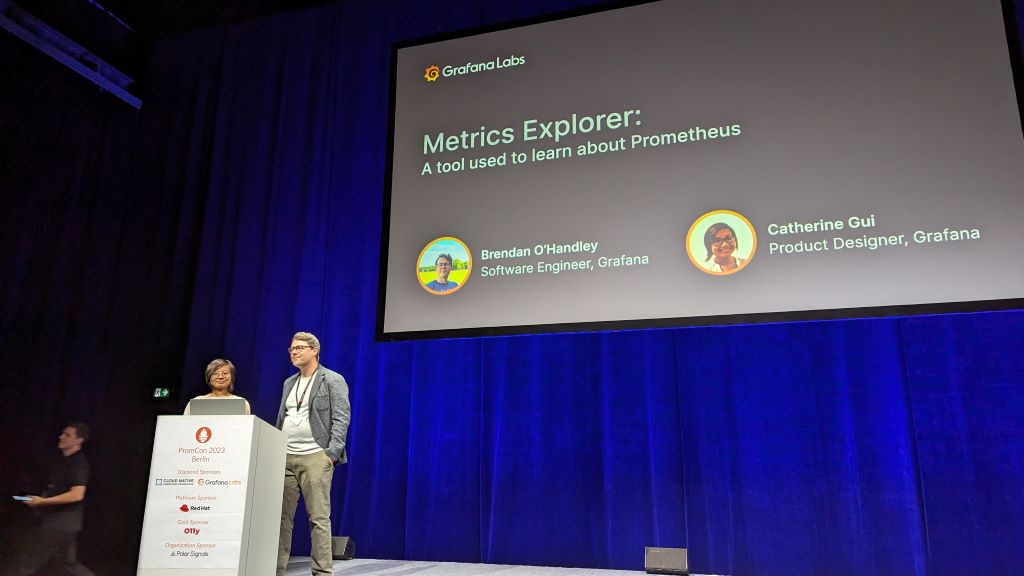
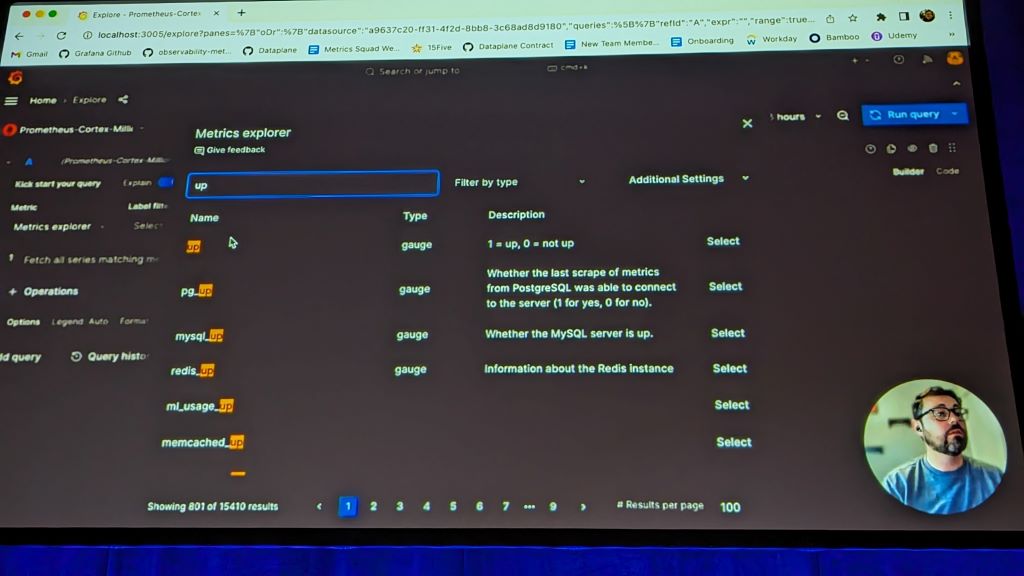
Brendan O’Handley and Catherine Gui from Grafana Labs draw attention to Prometheus users on beginners level. How to find right metrics of which metrics are present in general? For this the Grafana Metrics Explorer will help with a simple menu and overview.

Ankur Rawal and Dheeraj Reddy from Zenduty presented some really nice examples of bit.ly/promalerts
And that was the PromCon 2023 in Berlin. See you next year at PromCon 2024 in Berlin!